ESG Databook
SUSTAINABILITY
PICK UP DATA
Number of Employees
777
FY2024 (consolidated) Including temporary employees 137
-
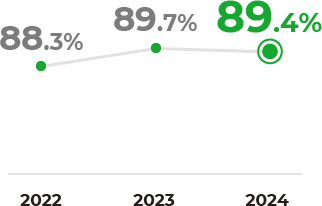
Regular Employee Retention Rate 
-
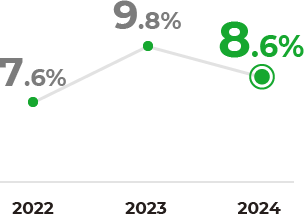
Rate of Women in Management Positions 
-
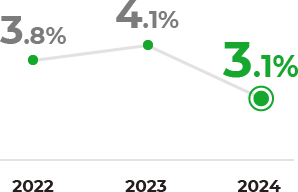
Hiring Rate with Disabilities in Work 

CDP Score
Climate Change
A-
The Group received a “A-” rating, the second highest out of nine, in a 2023 study on climate change conducted by CDP, an international non-profit organization.
Environment
Environmental Data
| Unit | FY2022 | FY2023 | FY2024 | ||
|---|---|---|---|---|---|
| CO₂ Emissions | Scope1 | t | 4,563 | 5,136 | 5,569 |
| Scope2 (Location-base) | 7,916 | 8,823 | 394 | ||
| Scope2 (Market based) | 229 | 1,219 | 12,073 | ||
| Scope3※1 | 152,463 | 443,808 | 735,676 | ||
| Energy Consumption | Fuel | TJ | 67.0 | 79.0 | 101.6 |
| Electricity | GWh | 18.2 | 20.4 | 28.0 | |
| % of Renewable Energy of Electricity | % | 97.3 | 86.5 | 96.3 | |
| Water | 1,000㎥ | 42.4 | 33.5 | 100.0 | |
| Resource Recovery Rate※2 | % | 94.4 | 94.9 | 95.8 |
※1. Scope 3: Categories 1 through 7 are counted in FY2022, Categories 1 through 15 except for Category 10 are counted since FY2023.
※2. Resource recovery rate is calculated from Output: (amount processed +
amount processed and distributed + recycling) ÷ (amount processed + amount
processed and distributed + recycling + waste disposal) x 100
For
more details: Sustainability Report P.33
Sustainability Report P.33
ISO Certified Sites
ISO 140016sites
Environmental Policy
The Envipro group Environmental Policy https://www.envipro.jp/en/company/compliance/#link07
Social
Human Resources Data
| FY2022 | FY2023 | FY2024 | ||||||
|---|---|---|---|---|---|---|---|---|
| Number of Regular Employees | Total | 498 | 632 | 640 | ||||
| Men | 393 | 509 | 509 | |||||
| Women | 105 | 123 | 131 | |||||
| Number of Management Positions | Total | 79 | 82 | 105 | ||||
| Men | 73 | 74 | 96 | |||||
| Women | 6 | 8 | 9 | |||||
| % of Women in Management Positions | 7.6% | 9.8% | 8.6% | |||||
| Average Age of Employees | Total | 38.7 | 41.9 | 41.9 | ||||
| Men | 39.1 | 42.4 | 42.7 | |||||
| Women | 37.0 | 38.8 | 38.2 | |||||
| Average Number of Consecutive Years Served | Total | 7years 5months |
7years 7months |
10years 3months |
||||
| Men |
7years 3months |
8years 2months |
11years 0months |
|||||
| Women | 5years 2months |
6years 4months |
7years 7months |
|||||
| Retention Rate | 88.3% | 89.7% | 89.4% | |||||
| Number of New Graduate Hires | Total | 17 | 4 | 10 | ||||
| Men | 11 | 3 | 6 | |||||
| Women | 6 | 1 | 4 | |||||
| Number of Employees Taking Parental Leave | Total | 5 | 2 | 8 | ||||
| Men | 2 | 1 | 4 | |||||
| Women | 3 | 1 | 4 | |||||
| % of Employees Taking Childcare Leave | Men | 17% | 8% | 44% | ||||
| Women | 100% | 100% | 100% | |||||
| Number of Employees Working Short Time for Childcare | Total | 3 | 1 | 5 | ||||
| Men | 0 | 0 | 1 | |||||
| Women | 3 | 1 | 4 | |||||
| Number of Employees Returning from Childcare Leave | Total | 6 | 3 | 5 | ||||
| Men | 2 | 2 | 3 | |||||
| Women | 4 | 1 | 2 | |||||
| % of Employees Returning from Childcare Leave ※1 | Men | 100% | 67% | 100% | ||||
| Women | 80% | 100% | 100% | |||||
|
Number of Emploees of the Short Time Regular Employee System※2 |
Total | 5 | ||||||
| Men | 0 | |||||||
| Women | 5 | |||||||
| Hiring Rate with Disabilities in Work ※3 | 3.8% | 4.1% | 3.1% | |||||
※ The range of data covers group consolidated and regular employees.
※1. Until FY2023, the number of employees using the short working time
system for childcare among those who returned to work on childcare leave
during the fiscal year was calculated.
From FY2024, the number is
calculated based on the number of employees using the short working time
system for childcare as of the end of the fiscal year.
※2. Short-time regular employee system started operation on July 1, 2023.
※3. The hiring rate with disabilities in work includes contract employees and is calculated using the prescribed calculation method.
Human Rights Policy
The Envipro group Human Rights Policy https://www.envipro.jp/en/company/compliance/#link06
Occupational Safety & Health
| Unit | FY2022 | FY2023 | FY2024 | |
|---|---|---|---|---|
| Number of accidents | - | 62 | 72 | 39 |
| Number of Industrial Accidents | 14 | 12 | 9 |
Information Security
Basic policy on Information securityhttps://www.envipro.jp/en/security/
Privacy Policyhttps://www.envipro.jp/en/privacy/
ISO Certified Sites
- ISO 450012sites
- ISO 270014sites
- ISO 9001 5sites
Governance
Composition of Board of Directors
| Unit |
2022 (as of the end of September) |
2023 (as of the end of September) |
2024 (as of the end of September) |
|||
|---|---|---|---|---|---|---|
| Internal Directors | Total | persons | 4 | 5 | 5 | |
| Men | 4 | 5 | 5 | |||
| Women | 0 | 0 | 0 | |||
| Outside Directors | Total | 8 | 6 | 6 | ||
| Men | 7 | 5 | 5 | |||
| Women | 1 | 1 | 1 | |||
| Total Number of Directors | 12 | 11 | 11 | |||
| % of Women on the Board | % | 8.3 | 9.1 | 9.1 | ||
|
Internal Directors who is a Member of the Audit and Supervisory Committee |
Total | persons | 0 | 0 | 0 | |
| Men | 0 | 0 | 0 | |||
| Women | 0 | 0 | 0 | |||
|
Outsidel Directors who is a Member of the Audit and Supervisory Committee |
Total | 4 | 3 | 3 | ||
| Men | 4 | 3 | 3 | |||
| Women | 0 | 0 | 0 | |||
|
Total Number of the Members of the Audit and Supervisory Committee |
4 | 3 | 3 | |||
|
% of Women Audit and Supervisory Committee Members |
% | 0 | 0 | 0 | ||
| Executive Officers | Total | persons | 4 | 4 | 4 | |
| Men | 3 | 3 | 3 | |||
| Women | 1 | 1 | 1 | |||
Age and Term of Directors
| Unit |
2022 (as of the end of September) |
2023 (as of the end of September) |
2024 (as of the end of September) |
|
|---|---|---|---|---|
| Average Age of Directors | Age | 64.4 | 61.7 | 62.6 |
| Average Tenure of Directors | Years | 6.8 | 4.3 | 5.1 |
| Age Limit of Directors | Term of Directors |
Term of Directors who is a Member of the Audit and Supervisory Committee |
|---|---|---|
| No limit set | 1year | 2years |
Number of Board Meetings, Audit and Supervisory Committee meetings
| Unit | FY2022 | FY2023 | FY2024 | |
|---|---|---|---|---|
| Number of Board Meetings | times | 15 | 15 | 15 |
| Number of Audit and Supervisory Committee Meetings | 14 | 14 | 14 |
Nominating and Compensation Committee
| Unit | FY2022 | FY2023 | FY2024 | |
|---|---|---|---|---|
| Number of the Members | persons | 5 | 5 | 5 |
| Number of the Meetings | times | 3 | 3 | 3 |
Political Contributions
| FY2022 | FY2023 | FY2024 |
|---|---|---|
| ¥0 | ¥0 | ¥0 |
Governance
Governance https://www.envipro.jp/en/company/governance/
Corporate Governance Report https://x.gd/KxiCE
